
A page can score 94 in PageSpeed Insights and still be marked as needing improvement in Search Console. Both can be right. They measure different things, and knowing which one to act on is most of the work with Core Web Vitals.
Quick answer: Core Web Vitals are three measurements of real visitors’ experience: Largest Contentful Paint (loading), Interaction to Next Paint (responsiveness) and Cumulative Layout Shift (visual stability). Judge them by field data from real Chrome users, use lab tools to find the cause, and fix the metric that is failing rather than chasing a perfect score.
The three metrics and their thresholds
Google’s Web Vitals guidance (opens in a new tab) sets a “good” target for each metric. A page passes when all three meet that target at the 75th percentile of visits, measured separately for mobile and desktop.
Metric | What it measures | Good | Needs improvement | Poor |
|---|---|---|---|---|
How long the largest image or text block in view takes to appear | 2.5 seconds or less | Over 2.5 up to 4 seconds | Over 4 seconds | |
How quickly the page responds visually to clicks, taps and key presses | 200 ms or less | Over 200 up to 500 ms | Over 500 ms | |
How much visible content moves unexpectedly | 0.1 or less | Over 0.1 up to 0.25 | Over 0.25 |
INP replaced First Input Delay as a Core Web Vital in 2024. First Input Delay only measured the wait before the browser started handling the first interaction; INP covers the full response to interactions throughout a visit.
The 75th percentile matters. It means at least three quarters of visits need a good experience, so a fast result on your own computer says little about visitors on older phones or slower connections.
Mobile and desktop are measured separately
Google reports each metric separately for mobile and desktop visits, and a page can pass on one and fail on the other. Mobile results are often worse because phones have less processing power and connections vary more, so check the mobile figures first if most of your visitors use phones.
Field data and lab data
Field data comes from real Chrome users. Google collects it in the Chrome User Experience Report (opens in a new tab) (CrUX), and it is what Google Search uses. A page needs enough public traffic to have its own field data; otherwise tools fall back to data for the whole site, or show none.
Lab data comes from a simulated page load in a tool such as Lighthouse. It is repeatable, which makes it good for diagnosing problems and checking a fix before it goes live. It cannot measure INP, because nobody interacts with a simulated load, so Lighthouse reports Total Blocking Time as a stand-in.
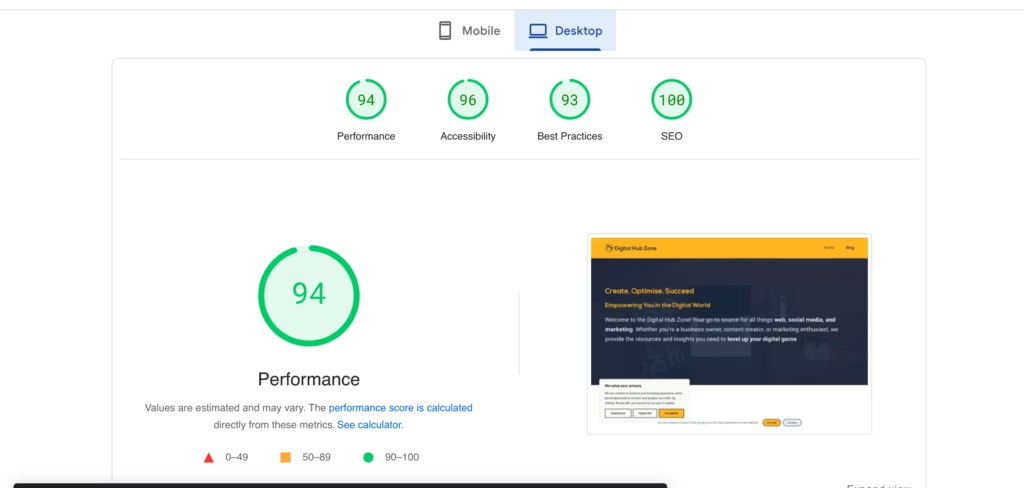
PageSpeed Insights (opens in a new tab) shows both: field data at the top when it exists, and Lighthouse lab results below. The performance score of 0 to 100 is a lab result. It is not a Core Web Vitals assessment.
The Core Web Vitals report in Search Console (opens in a new tab) uses field data. It groups pages with similar experiences, and a group’s status is set by its worst metric. A group with good LCP and INP but poor CLS is reported as poor.
Which tool to use for what
Tool | Data | Best for |
|---|---|---|
Search Console Core Web Vitals report | Field | Seeing which groups of pages fail, on mobile and desktop, and confirming fixes |
PageSpeed Insights | Field and lab | Checking one page, and finding the LCP element and other diagnostics |
Chrome DevTools | Field and lab | Recording a trace to see exactly what slows a page or an interaction |
Lighthouse | Lab | Repeatable tests before and after a change |
The web-vitals JavaScript library | Field | Collecting Core Web Vitals from your own visitors, including on pages without CrUX data |
Google’s Web Vitals guidance describes the web-vitals library as the easiest way to measure all three metrics on your own site.
Do Core Web Vitals affect rankings?
Yes, but less than many guides suggest. Google’s page experience documentation (opens in a new tab) says its ranking systems use Core Web Vitals, but there is no single page experience signal and relevance comes first. Good scores help most when several pages are equally useful for a search. Google advises against chasing a perfect score for SEO reasons alone.
Our view is that Core Web Vitals are worth fixing because a slow or jumpy page loses visitors, with any ranking benefit as a bonus.
How to improve each metric
Start with the metric that is failing in field data, on the device type where it fails.
Largest Contentful Paint
Find the LCP element first. PageSpeed Insights names it in its diagnostics. It is usually a hero image or a large heading.
Google’s guide to optimising LCP (opens in a new tab) splits the time into four parts: server response, the delay before the LCP resource starts loading, the time spent downloading it and the delay before it is drawn. Fix the largest part first.
- Never lazy-load the LCP image. Lazy loading delays it on purpose.
- Add
fetchpriority="high"to the LCP image, and to no more than one or two images. - Serve the image at the size it is displayed, in a modern format such as AVIF or WebP, and use
srcsetso phones download a smaller file. - Compress images before uploading, and lazy-load only images further down the page.
- Reduce server response time with page caching and, where visitors are spread out, a content delivery network.
- Avoid hiding the main content until scripts run, such as sliders or fade-in effects on the hero area.
The website speed optimisation guide covers images, caching and hosting in more detail.
Interaction to Next Paint
Poor INP comes from work that keeps the browser busy when someone clicks or types, such as long JavaScript tasks or heavy rendering. Find the slow interaction, such as a mobile menu or cookie banner, then reduce or break up the work it triggers.
- Remove scripts and plugins that are not needed, especially third-party widgets.
- Defer scripts that are not needed for the first view, using
deferor loading them after the page has rendered. - Split long tasks so the browser can update the screen between them.
- Keep the page structure simple, since very large pages take longer to update after each interaction.
Our guide to improving Interaction to Next Paint walks through diagnosis and fixes.
Cumulative Layout Shift
Layout shift happens when content appears without space reserved for it. Common causes are images and videos without dimensions, adverts and embeds that resize themselves, content inserted above what the reader is looking at, and web fonts that render at a different size from their fallback.
- Set
widthandheighton images and video, or use the CSSaspect-ratioproperty. - Reserve space for adverts, embeds and cookie banners before they load.
- Add new content below the reader’s position, not above it.
- Choose fallback fonts close in size to your web font, and preload the most important font files.
- Animate with CSS transforms rather than changing an element’s size or position, which moves the content around it.
The Aspect-Ratio Calculator helps work out dimensions for responsive media.
Supporting metrics
Several further measurements help explain a failing Core Web Vital. None of them is a Core Web Vital itself.
Metric | What it shows | Helps explain |
|---|---|---|
Time to First Byte (TTFB) | How long the server takes to start responding | Slow LCP caused by hosting or missing caching |
First Contentful Paint (FCP) | When the first text or image appears | Slow LCP caused by render-blocking files |
Total Blocking Time (TBT) | How long scripts block the browser during a lab load | Likely INP problems, in lab tests |
Speed Index | How quickly the visible page fills in during a lab load | General loading problems |
How to monitor progress
Check the Core Web Vitals report in Search Console once a month, and after any theme, plugin or design change. Field data is collected over several weeks, so improvements take time to show. When you fix an issue, start validation in the report: Search Console then monitors the affected pages for 28 days before marking the issue as fixed.
Use lab tests to confirm a change works before you release it, then rely on field data to confirm it worked for visitors. Keep a short record of what you changed and when, so you can match changes to movements in the reports.
Next step
Open the Core Web Vitals report in Search Console, note which metric fails on which device, and start with the matching section above. If INP is the problem, go straight to the INP guide.